Agevolazioni, esenzioni, detrazioni & Co. La crescita delle spese fiscali (e del loro costo per lo Stato) nei Rapporti annuali 2016-2022

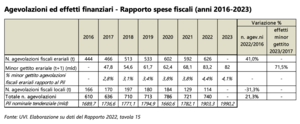
Dal 2016 al 2022 le spese fiscali erariali sono cresciute in maniera costante: nel 2022 se ne contavano 626 (+40% rispetto a sei anni prima) con effetti fiscali sul bilancio pari a -82 miliardi di euro (+72%). A queste vanno aggiunte altre 114 spese fiscali locali, per un totale di 740 agevolazioni. Chi ne beneficia? E quanto ci costano?
La pubblicazione dei Rapporti annuali sulle spese fiscali, insieme ai Rapporti programmatici allegati alla NADEF, ha migliorato la trasparenza. Ma il percorso da compiere è ancora lungo: quasi l'80% delle misure presenta dati incompleti su oneri, beneficiari o importi pro capite, e per quasi il 28% non è fornita alcuna stima (o è indicato un valore di trascurabile entità).
A distanza di cinque anni dall'ultimo dossier, l'UVI torna ad analizzare il fenomeno. E rileva come le frequenti e rilevanti deviazioni dal regime fiscale "normale" contribuiscano ad aumentare la complessità del sistema e a ridurne la trasparenza, a fronte di perdite di gettito consistenti: il 4% del PIL.
Allowances, exemptions, rate reliefs and tax deferrals. The growth of tax expenditures (and their cost to the State) in the annual Reports 2016-2022
From 2016 to 2022, tax expenditure increased steadily: in 2022 there were 626 (+ 40% compared to six years before) with fiscal effects on the budget of -82 billion euros (+ 72%). A further 114 local tax expenditures have to be added to these, for a total of 740. Who benefits? And how much do they cost us?
The publication of the Annual Tax Expenditure Reports, together with the Programme Reports annexed to the NADEF, improved transparency. But we have a long way to go: almost 80% of the measures have incomplete data on charges, beneficiaries or amounts per capita, and for almost 28% are not given any estimates (or a negligible value is reported).
Five years after the last dossier, the UVI returns to analyse the phenomenon. Notes that the frequent and significant deviations from the 'normal' tax regime contribute to increasing the complexity of the system and reducing its transparency, in the face of substantial revenue losses: 4% of GDP.


 Focus
Focus

